Power BI is a business analytics service provided by Microsoft that lets you visualize your data and share insights. It converts data from different sources to build interactive dashboards and Business Intelligence reports.
Power BI Service
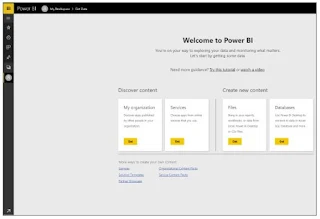
Power BI service is the Software as a Service (SaaS) part of Power BI. It is also known as Power BI Online. To access Power BI Service, you need to log in to Power BI service.
Here is how the home page of Power BI Service looks like once you log in:
Components of Power BI
Power Query
Power Query is the data transformation and mash up the engine. It enables you to discover, connect, combine, and refine data sources to meet your analysis need. It can be downloaded as an add-in for Excel or can be used as part of the Power BI Desktop.
Power Pivot
Power Pivot is a data modeling technique that lets you create data models, establish relationships, and create calculations. It uses Data Analysis Expression (DAX) language to model simple and complex data.
Power View
Power View is a technology that is available in Excel, Sharepoint, SQL Server, and Power BI. It lets you create interactive charts, graphs, maps, and other visuals that bring your data to life. It can connect to data sources and filter data for each data visualization element or the entire report.
Power Map
Microsoft's Power Map for Excel and Power BI is a 3-D data visualization tool that lets you map your data and plot more than a million rows of data visually on Bing maps in 3-D format from an Excel table or Data Model in Excel. Power Map works with Bing maps to get the best visualization based on latitude, longitude, or country, state, city, and street address information.
Power BI Desktop
Power BI Desktop is a development tool for Power Query, Power Pivot, and Power View. With Power BI Desktop, you have everything under the same solution, and it is easier to develop BI and data analysis experience.
Power Q&A
The Q&A feature in Power BI lets you explore your data in your own words. It is the fastest way to get an answer from your data using natural language. An example could be what was the total sales last year? Once you've built your data model and deployed that into the Power BI website, then you can ask questions and get answers quickly.
Features of Power BI
Following are some of the features of Power BI -
Power BI Desktop
Power BI Desktop is free software that you can download and install, and it allows you to build reports by accessing data easily. For using Power BI desktop, you do not need advanced report designing, or query skills to build a report.
Stream Analytics
Power BI's primary advantage is its support stream analytics. From factory sensors to social media sources, Power BI assists in real-time analytics to make timely decisions.
Multiple Data Sources
Support for various data sources is one of the vital features of Power BI. You can access various sources of data such as Excel, CSV, SQL Server, Web files, etc. to create interactive visualizations.
Custom Visualization
While dealing with complex data, Power BI's default standard might not be enough in some cases. In that case, you can access the custom library of visualization that meets your needs.
Now, to better understand what is Power BI, and how does it helps, let us look at a case study on how Meijer, which is one of the United States' largest supermarket chains, used Power BI to solve its business problems.


.gif)
0 Comments